Re; DMRB CS450, The Inspection of Highway Structures.
Re; DMRB Highway Structures & bridges. Inspection & Assessment CS469, The Management of Scour and other hydraulic actions at Highway Structures.
Bridge Scour Management to CS469 Limited can offer both Level 1 and level 2 Scour Risk Assessments for highway bridges in accordance with the DMRB CS469 code.
Completed assessments to CS469; None. As this code came into effect in April 2024, the take up by bridge owners for scour risk assessments has been relatively slow so far.
Since this new company has been set up it has now been approved onto the Suppliers List for AtkinsRealis in Warrington.
The previous Praeparatus Ltd. Consultancy completed in the last 4 years, 155no. Level 1 and 92no. Level 2 BD97/12 bridge scour risk assessments for Warwickshire C.C. and 11no. Level 2 scour risk assessments for Solihull Met. B.C.
In early 2024 we have completed fifteen bridge scour risk assessments, at Level 1 & level 2 to BD97/12 for Inertia Consultancy, Derby.
CS469 has now incorporated two types of scour susceptible structure: Type One: Watercourses with both fluvial & tidal influence. The majority of bridges will be just over rivers subject to only fluvial storm flows. Type Two: Structures that are not over a normal live flow watercourse but are subject to flood flows, viz. flood relief arches. There is also now major section on the effect of the presence or risk of accumulation of woody debris after research from the University of Exeter Level 1 Assessment The Level 1 scour risk assessments are prepared using the data from an underwater examination and the flood plain information for each bridge site. The Level 1 scour risk assessment determines if the initial risk rating for the bridge is below or above 10. It summarises the geometry of the bridge, the history of scour, the presence of any scour protection, the angle of attack the river has to the bridge supports and the approximate grading of the river bed material. CS469 now also includes a section for the risk or presence of woody debris accumulation. Several assumptions are made if no information is available, such as the type and depth of the bridge foundations, and the general hydrology of the river. If the risk score is 10 or less it is deemed Low Risk, then there is no need to proceed to a Level 2 assessment. If the risk score is above 10 then the process proceeds to a Level 2 SRA. Here the outcome is for the other scour risk scores, 40, 60, (Medium Risk) or 80 or 100, (High Risk).
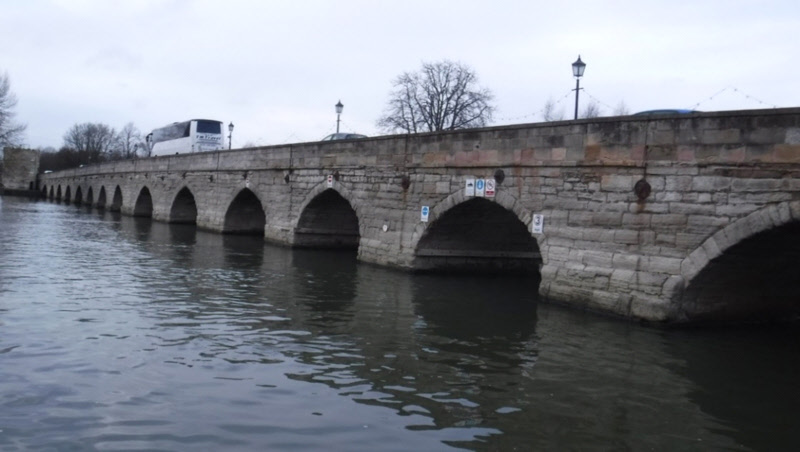
A Typical Bridge – Upstream Elevation
Level 2 Assessment – Design Flood Discharge A Level 2 bridge scour risk assessment is in accordance with CS469 and the FEH five volume set of handbooks. It utilises the Catchment Descriptors as the CD3 file output from the FEH website for each bridge catchment. The runoff from a storm with a return period of 1:2 years, the Index flood, from the catchment at the bridge site is calculated using the WINFAP v 4 software as the volume, QMED in cu.mecs. A map of the catchment is copied into the report and illustrates the location of the bridge site and any river gauging stations that lie within the catchment. As most of the bridge sites do not have a nearby river gauging station to use as a Single Site Analysis, an ungauged catchment at the bridge site is used.
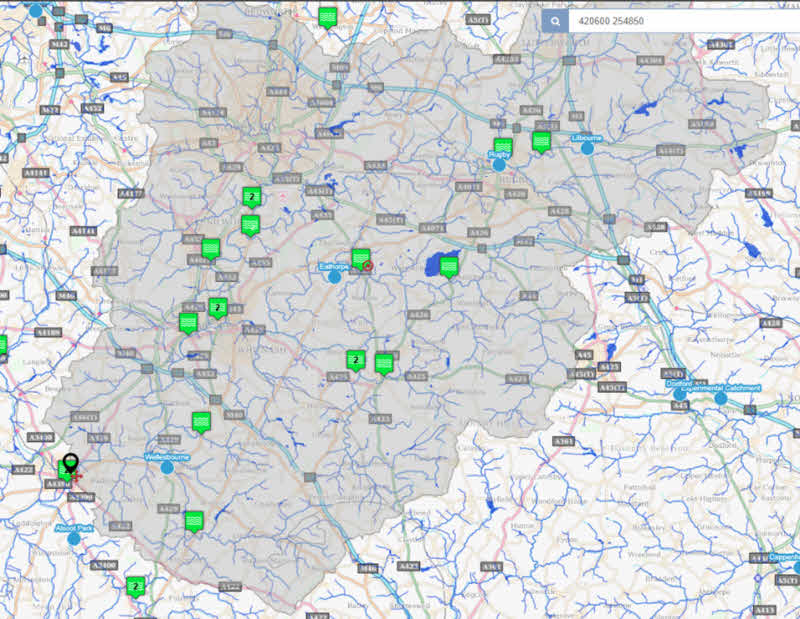
The FEH Web site catchment map.
The WINFAP v 4 software draws on the NRFA Peak Flow Data Set (Sept. 2024 latest) to gather a Pooling Group of hydrometrically similar gauged catchments to the bridge target catchment. The minimum Pooling group size must have a total record length of a least 500 years of Annual Maximum (AM) data. The pooled group is usually comprises of 10 to 15 gauged catchments. The individual catchments from the group are essentially rural i.e. have a URBEXT2000 value of <0.03.
A growth curve is developed from the pooled group of catchments which is then adjusted for urbanisation by the WINFAP Urban adjustment procedure.
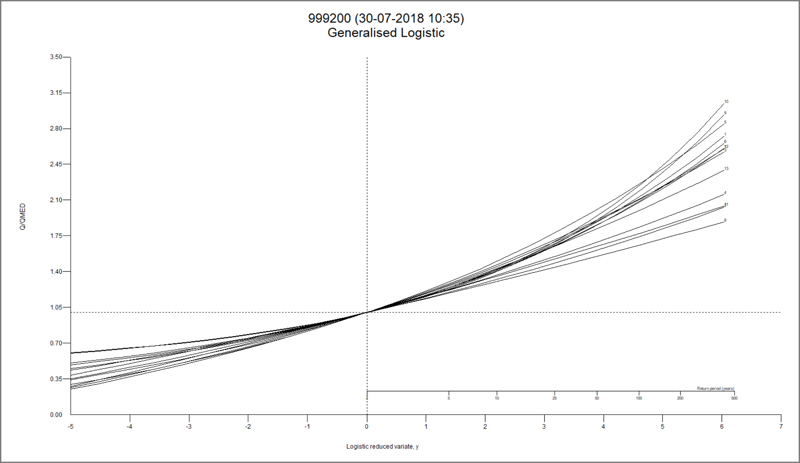
Growth curves for the Pooling Group.
The software than produces a Flood Frequency curve as a product of the growth curve and the urbanised QMED drawn from the pooled catchments.
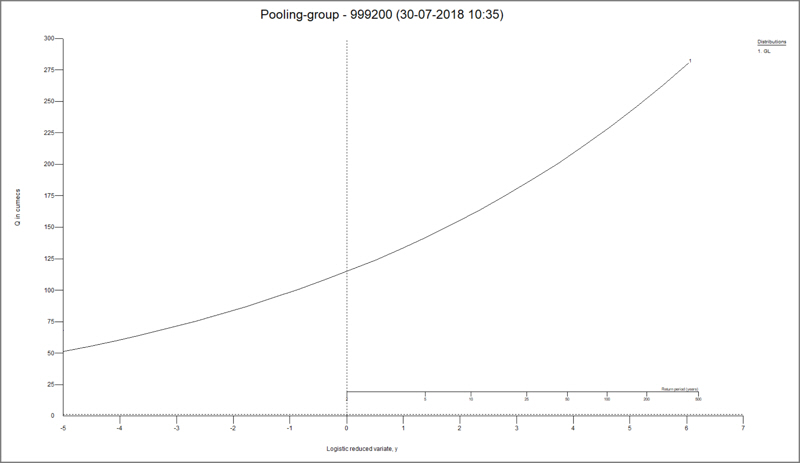
The flood curve with storm return periods.
The CS469 requirement for a 1:200-year storm return period discharge is now taken from the flood frequency curve and table for input into the Level 2 scour risk assessment. Note, the Index flood is for a return period of 2 years
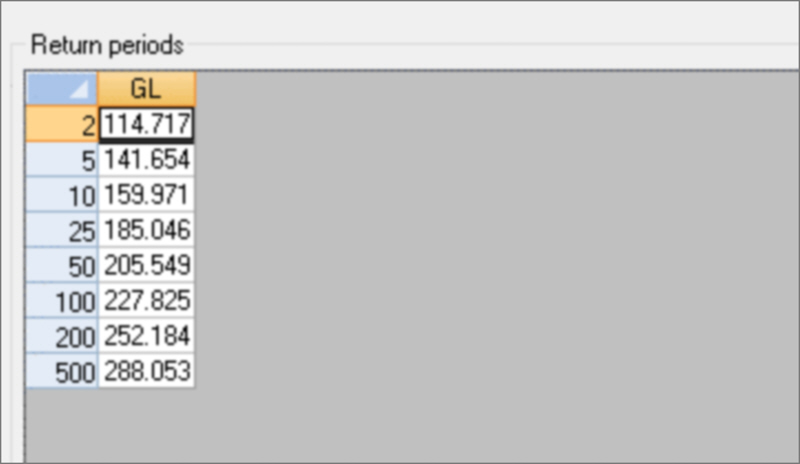
Summary Table for a selection of return periods – 0.5% AEP or 1:200 is used for CS469. In the above example the Index flood flow (1:2 year) is 114.717 cu.mecs.
Level 2 Bridge Scour Risk Assessment
The process to determine the scour risk at a bridge is summarised as follows:
- The flood discharge for a storm of return period 1:200 is adjusted for climate change and tidal influences. The additional allowances for climate change and sea level rise are now to be in accordance with the CS469. They are taken from one of the four National Application Annex N.A.A. for England, Northern Ireland, Scotland or Wales. CS469 N.A.A. now lists for each country, allowances for climate change (+approx 50% for some Scottish catchments) and tide level rises of up to +1m by 2100!
- The bridge data is drawn from the level 1 assessment with minor changes to ensure the data is correct and compatible. The river bed slope is now to be taken from within the defined distance of the structure, usually 100m upstream of the bridge.
- The geometry of the bridge supports is listed with the relevant angles of river attack and the depth of score is now to be calculated for each element of the structure: abutments, piers & walls.
- Three types of river cross sections are examined from a wide river channel, a more typical trapezoidal cross section and one where the river banks are over topped. If the river banks are over-topped then the flood plain characteristics are used to calculate the flood water depth and velocity. The current EA Flood plain widths for Zone 3 gives at least a 1:100-year return period storm for three sectors upstream of the bridge are shown as an illustration. However, CS469 requires a flood map for the 0.5% AEP or the 1:200 year flood. Hence each of the N.A.A. ‘s are being contacted to provide the flood maps for the 0.5% AEP flood.
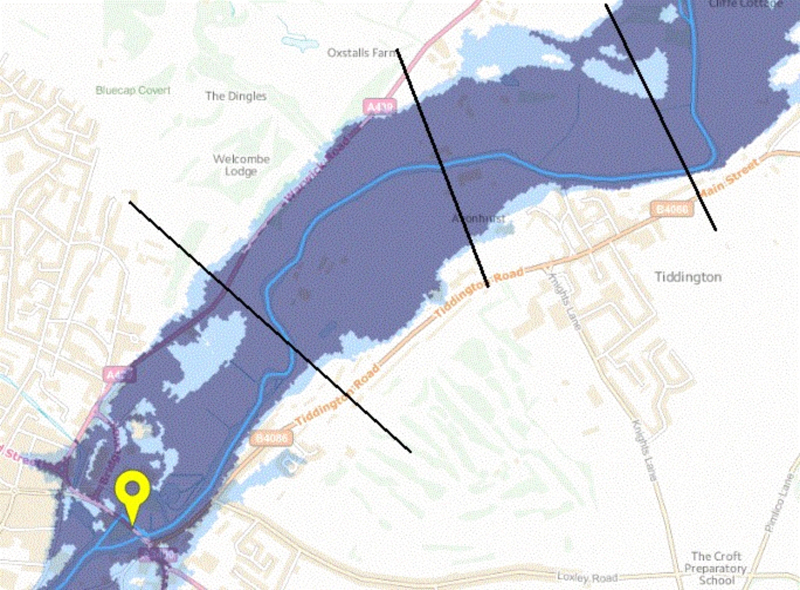
The E.A. Flood zone 3 at the bridge site for a 1:100-year or greater annual probability storm.
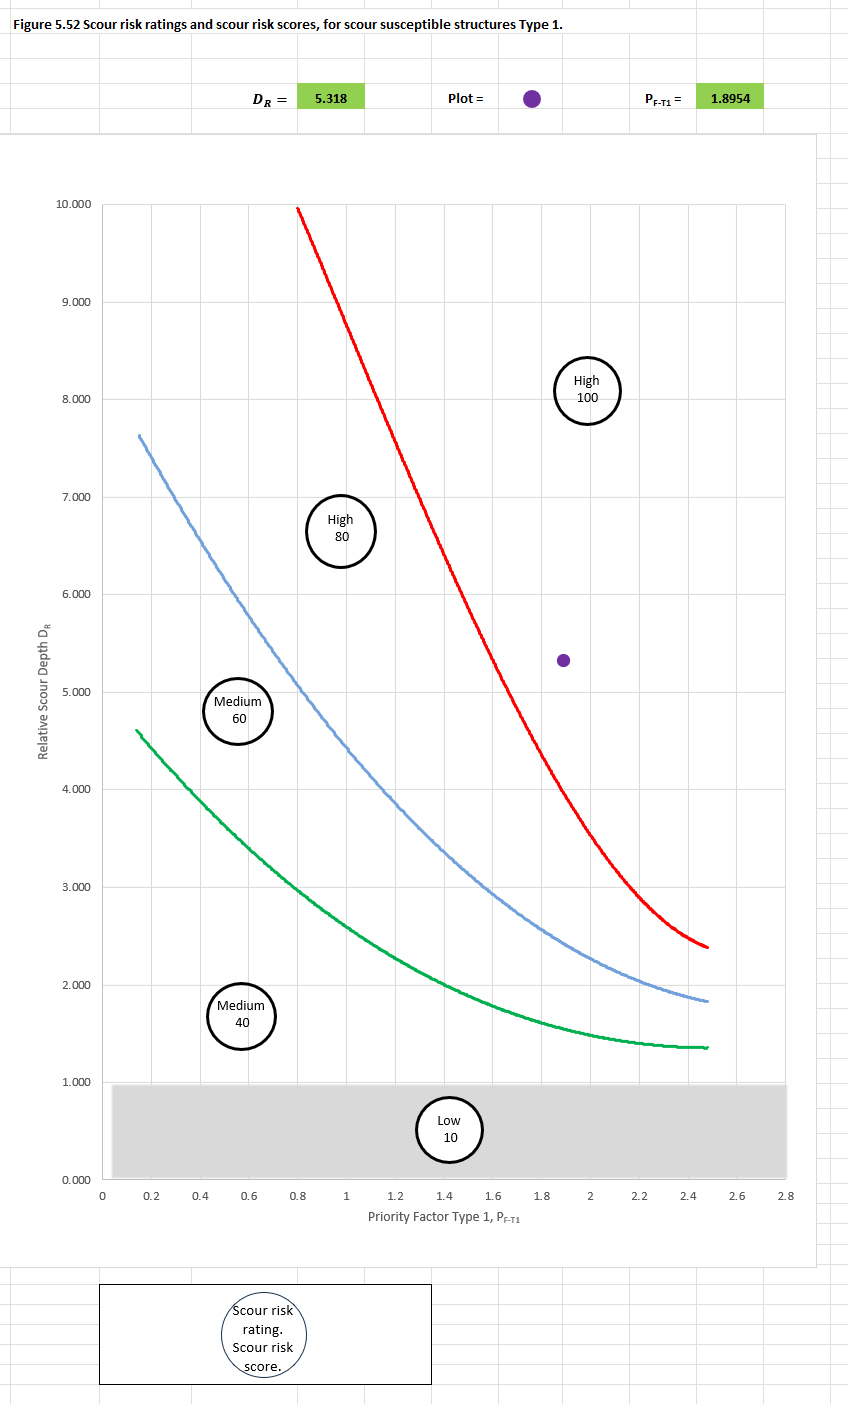
- (This graph is to be revised and to correspond with the Scour risk rating graph of CS469.) There is a new graph that has now been incorporated in to the Level 2 SRA workbook.A summary of the Scour Risk ratings and scour risk scores for scour susceptible structures Type 1 is shown below:
A Level 1 SRA determines if the scour risk score is below or above 10.Score Risk Rating: Low Risk – Scour Risk Score 10.A Level 2 SRA determines if the scour risk score is between 10 to 100:Score Risk Rating: Medium Risk – Scour Risk Score 40 or 60.Score Risk Rating: High Risk – Scour Risk Score 80 or 100.